Not having a solid understanding of how to debug your code correctly can waste hours of your life. The quicker you can fix issues, the more legendary your developer reputation will become. The aim of this tutorial is to teach you some skills that will allow you to debug your ReactJS based applications quicker and more efficiently. Sound good? Let's begin!
Debugging in Chrome With Webpack
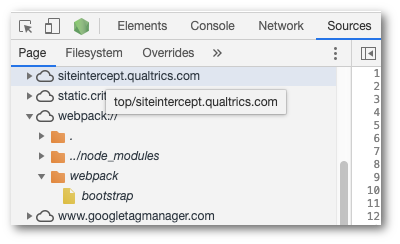
This is the frontend-developers go-to debugging tool. Running the application in a browser and seeing what errors are thrown is usually the quickest and easiest way of debugging your code. As long as you have source-maps enabled in your webpack build, you should be able to do some really useful debugging things within your browser. In Chrome, you can see what code the browser is running. You can even add debugging breakpoints that will stop the running application at certain key points and inspect what data is being passed around. To do this, open your application in Chome and then open up the dev tools console. Open the sources tab, within the page explorer find an entry called webpack://.
To debug anything, simply find the bit of code you want to debug, open it, then create a breakpoint in the line you want to inspect. You can do this by clicking on the line number.
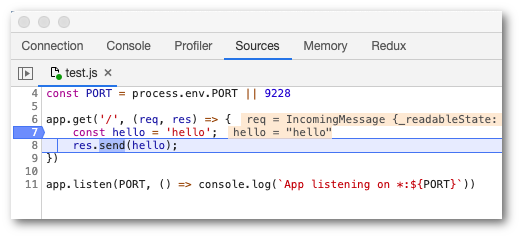
Reload your page in the browser and the breakpoint should trigger when the application tries to run,
Debugging in VS Code
If you do not have 'sourcemap 'enabled in your build, or, you simply prefer to debug in VS code, you can. First, create a debug configuration in VS code will allow you to debug your client-side code in VS code. If you are new to creating VS debugging, I suggest you read Debugging server side Javascript applications first.
This config will allow you to attach VS-Code to Chrome. In this example, the computer port VS-code that will use to talk to Chrome will be '9222'. Next, you will need to open Chrome on that port, otherwise, the debugger will not attach. You can open Chrome on a specific port by using this command:
If you think attaching to Chrome on a specific port seems like a lot of hassle, you can also get VS Code to launch a new Chrome tab for you. This can be done using this VS-config debugging config instead:
These four techniques will allow you to start debugging most applications, regardless if they have source-maps enabled or not. The trick to debugging is being able to set a breakpoint around the trouble area so you can inspect the data. Usually, after getting your debugging tool to hit a breakpoint, bugs tend to become obvious. As you can see from all the configurations, there are numerous properties that are available to you to configure debug configuration. A full list can be found here. Happy Coding 🤘