One of the most essential skills that a web developer needs to possess is the ability to quickly and accurately debug code. Being able to quickly find out why a system is not behaving the way you want it to is a really important part of being a developer. The techniques that you use to debug your javascript code will depend on where on the stack your code is running. Most modern Javascript apps are built 'isomorphically' - meaning server and the client (browser). In this tutorial, you will learn several techniques that will allow you to debug server-side code. You will learn how to debug code that is written using NodeJS or even ExpressJS. In these types of systems you will not be able to use a web browser... so what do you do?
Basic Serverside Debugging in VSCode
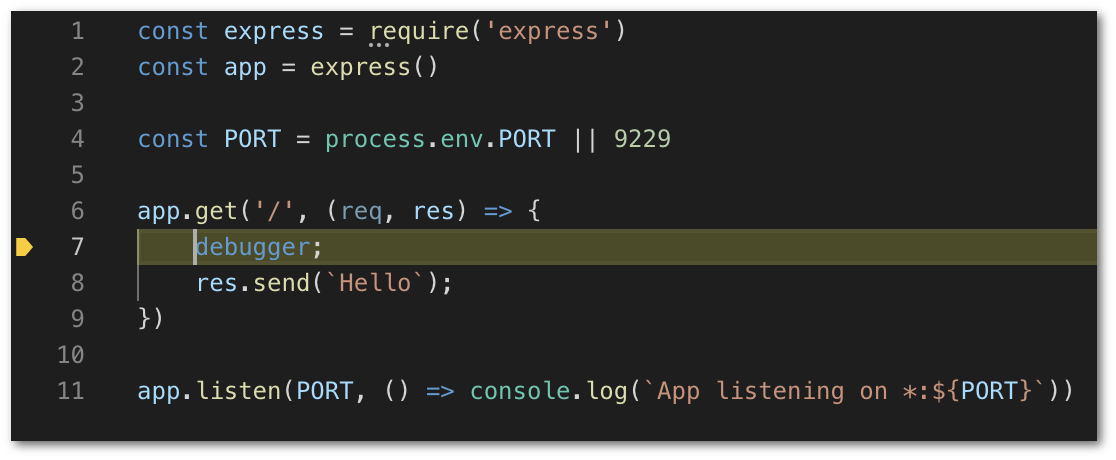
The good news is that if you use VS-code you have a great debugging tool at your fingertips. Let us imagine that you have a basic ExpressJS server, in a file called test.js:
A key to debugging are breakpoints. Adding breakpoints within your application using the debugger command will make the application stop at certain key areas. This should allow you to inspect the code using VS-code and see what is going on and peak at the internal state of the application while it is running. To make the compiler stop on these commands, when launching the application from the command-line, you can use the--inspect flag, like so:
Assuming the code above compiles successfully, you should be able to open a browser trigger the server using this URL, http://localhost:9229/. When the server end-point gets called, the application should stop on the debugger statement, like so:
Debugging In Chrome
Getting a breakpoint to hit on your server-side code within VS is handy in some situations. In other situations, you have complex web pages you want to debug within Chrome instead. In Chrome, in the URL, enter “about:inspect” to open the inspect with chrome tab. Click on the 'Open dedicated DevTools for Node' button. This will allow you to debug Node modules by giving you access to the NodeJS code!
My Web App Is More Complex Than A Single Script!
All the above tips are great if you have a very simple express server, but what happens if you have a complex app that you built with webpack? For example, you may not be able to simply run a single command that points to a single JS file.
One way to make your life easier is to create a debug configuration within VSCode. To access your current project's debug configurations, in VS code, open up the debug tab. In the top left of the editor, you should see a dropdown with the word DEBUG next to it. Click the gear button and it will create or open a file called launch.json. If you have no previous configurations set up this file will be empty. Here you can configigure how the debugger will work for your application, both client and server-side configurations. A simple debug configuration that attaches to a node server would look like this:
After adding some config, you should see a launch.json file created in your projects root directory. Having a launch.json file is handy. It can be checked into your source control so the debugging configurations can be shared by your team. This means new starters will not have to manually configure VS-Code for debugging themselves! More information on how to do this can be found [here](https://www.jondjones.com/tactics/productivity/how-to-set-up-visual-studio-code-to-do-inline-react-debuggi
As long as your node application is running, when you start debugging within VS code the debugger should now get triggered when you click the little green debugging icon. One interesting bit to note in the config above is that I have set the timeout value to a really high number. The apps that I've been working can take 2-3 minutes to load, without a high timeout value, the debugger fail to attach correctly. If your app runs pretty quickly, then you can omit this.
Issue Connecting
Sometimes getting the debugger to attach can be a pain in the ass. I've wasted hours of head-scratching trying to figure out why the debugger is not working. If you find yourself in this situation, here are some other useful troubleshooting tips to consider.
In the snippet above, I'm using the default port of 9229. If you find the debugger has issues connecting, then you can try seeing what's currently attached to that process. You can do this by using this command (on MAC only)
If there is already something running on that port, the command will show you some useful information:
From experience, I've found that sometimes the debugger doesn't detach correctly and this tip has saved me quite a few times. In a lot of instances when running this command, you will see the old debugging process blocking the request. Assuming you do ot want the application running, you can close it using the PID ID.
Connect By process ID
A really handy tool when you encounter issues attaching to the debugger is to use the ${command:PickProcess} command (as seen on line 6). When you use this and try to attach, VS-code will prompt you to manually select which process you want to connect to.
With YARN
If you use yarn or 'npm' to debugging your application, you can tell VS-code which script to use when you launch the debugger. This is done using the runtimeArgs command, like this:
As you can see from all the configurations, there are numerous properties that are available to you to debug server-side Javascript code. A full list of what VS-code allows can be found here. Happy Coding 🤘