In this tutorial, you will learn loads of useful tips and tricks in order to help debug Umbraco CMS issues. Finding and fixing bugs usually takes up about 60% of my time on a project. This guide is a LIVING list of helpful troubleshooting tips to help you try and identify and resolve any Umbraco issues you might encounter. These tips are the ones any new Umbraco developer will typically need to run through before going to the Umbraco forum. If you are currently struggling to debug a Umbraco issue, this is the tutorial for you 🔥🔥🔥
Troubleshooting Tips For Umbraco Issues
- Check the Umbraco Logs for errors. The log files in Umbraco is a goldmine of information when it comes to debugging. Any exception the website throws will be logged within the logs. If you are having problems with a page, a user control, macro or package this is the place to look. These logs can be found within your webroot here:
App_Data ➡ Logs
Lot of useful information can be found within the
umbracoLogtable in the database. Open SSMS and see if there is anything useful in here.If you are running Umbraco v7.5 onwards, you can run the health check tool from within the CMS to check for potenial issues. More information about that can be found in this post.
Enable Mini-profiler to try and trace and profile what the current request is doing.
Load the site and look within Chrome’s Web Developer tools. Look in the
Consoletab for errors. Look in theNetworktab to make sure all your CSS, JS and web API calls have loaded correctly.Use Visual Studio to step through your code and add tactical breakpoints all over the codebase. Launch the site in debug mode:
Debug ➡ Attach To Process
Select the w3wp.exe process. When you run the page, the breakpoint should hit.
- For older Umbraco issues, you might not be able to use a mini-profiler. In these instances, you can show more debug information via the
Debugquery string. You must be running your site in debug mode for this to work. You can check this within yourweb.config. Add theumbDebug=truequery string to the end of any web request Url to show debugging information inside the rendered page. To enable/disable this, you need to setumbracoDebugModein yourweb.configwithin the app settings section.
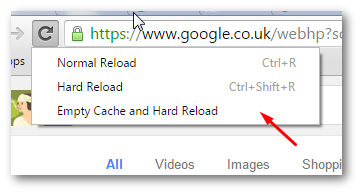
- Clear your browser cache. If you right-click on reload icon within your browser, you should have an option called
Clear Cache and Hard Reset. Click on it:
Reset your website by doing an IISREST. Alo clear your sites temp internet files
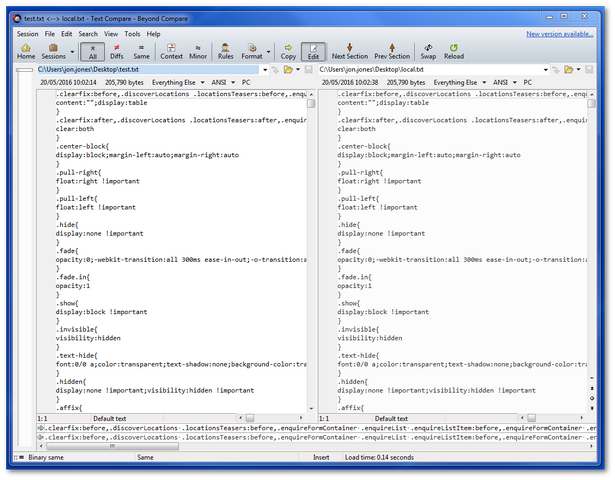
Download/create a clean install of Umbraco with the same version of your website. Use a folder comparison tool like Beyond Compare. Perform a folder and file comparison to make sure you have all the assemblies and config sections Umbraco requires:
See if the issue is browser-specific by using different browsers (IE, Firefox, Chrome).
If the error is related to not being able to find some code, use DotPeek to look inside the
.dlland see what code has been deployed. It is very common that the code that you assume should be deployed isn't and you need to re-deploy something.If you encounter an error after you have installed a new Umbraco package, re-install or remove all your packages to make sure that's not the issue.
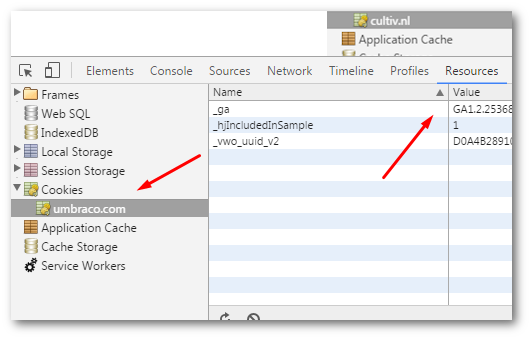
Clear your Cookies. To do this in Chrome, go here:
DevTools ➡ Resources ➡ Cookies
Right-click on your website and select clear:
I feel very confident that if you follow all of these steps, you will be able to diagnose any Umbraco issue. Happy Coding 🤘