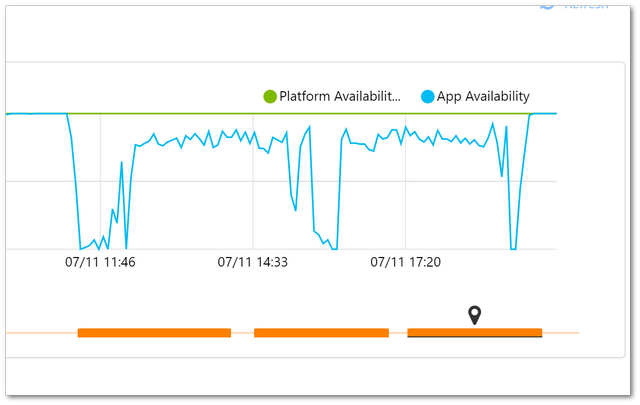
In this tutorial, you will learn about some performance tips that will help you boost your Umbraco powered websites page performance. Recently, I've been having a few performance issues of my own with my Umbraco website. Like most issues, the issues were within my application, rather than with the CMS itself. As you can see from the screenshot below, my Azure hosting was fine (that's the green line), the blue line that's jumping all over the place means my website keeps crashing for some reason.
My challenge was to figure out what was going wrong. Debugging random performance wobbles is never fun and it is usually harder than it sounds. If the issues are occurring on a live production website, there's usually added pressure to get a site up and running and working correctly, not fun 😒😒😒If you need help in this area, read on.
Umbraco Website Is Running Slowly... Help
My website started running really slowly during sporadic periods. After deploying code, it ran quickly. After a while, performance started degrading and page speed became slower and slower. I rule out the issue being a DDOS attack. If you don't know what a DDOS attack is, think of it as someone spamming your website with lots and lots of requests. To prevent DDOS attacks you can use a CDN. I use Cloudflare as a CDN which has DDOS protection, so that ruled out malicious activities. The first thing I did was log into Cloudflare and manually enable my DDOS protection. This did nothing, so the next step was to FTP into my Azure account and go through the log files to check what errors were being reported. I wanted to figure out what was going wrong. BTW... if you're not using a CDN, or, DDOS protection then I recommend you go and check out Cloudflare, as it's free 💰
Uss The Diagnosis Tab On Your Umbraco Web App
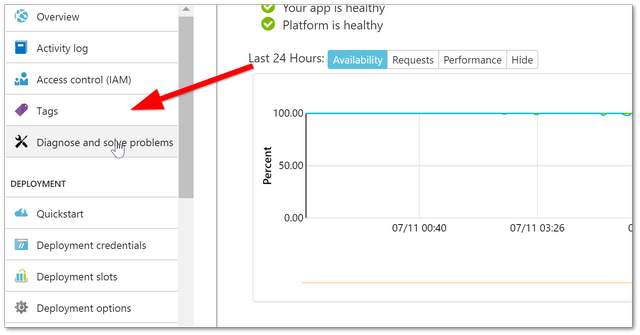
Azure has a number of useful tools to help you try and diagnose performance issues. One of the first tools that I use is the 'diagnose and solve problems' page in Azure portal:
You need to make sure Application Insights is installed, otherwise, the amount of information you can get from here is limited. Application Insight is the Azure, is the out-of-the-box monitoring software supplied with Azure. It is kind of like New Relic... ish. To get application insights to work, you need to install it via NuGet. Simply search for 'Application Insights' and install it. One thing to note, you need to enable it in Visual Studio before it will work. I find the most useful screen in application insight to be the performance screen. From here you see which controller is taking the longest amount of time to load. This might tell you if you have one specific issue, or, a global issue
Application Insights
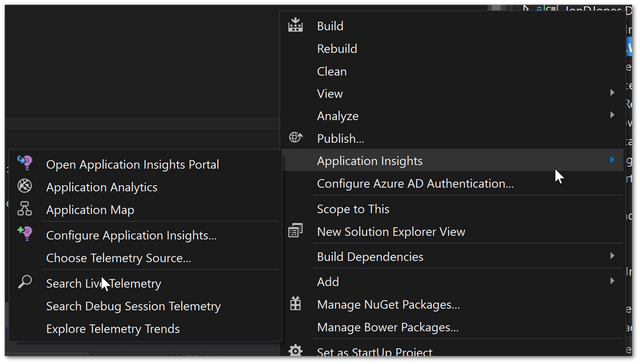
When I first enabled Application Insights within Umbraco I encountered a Log4Net error. Umbraco has a separate log4net.config in the config folder. While the NuGet package installed a number of config changes were also applied automatically to the webl.config. This mismatch caused the site to crash. If this happens remove the config related to application insight logging from the web.config and move it into log4net.config. To make sure application insights is installed, simply right-click on your website project and enable it:
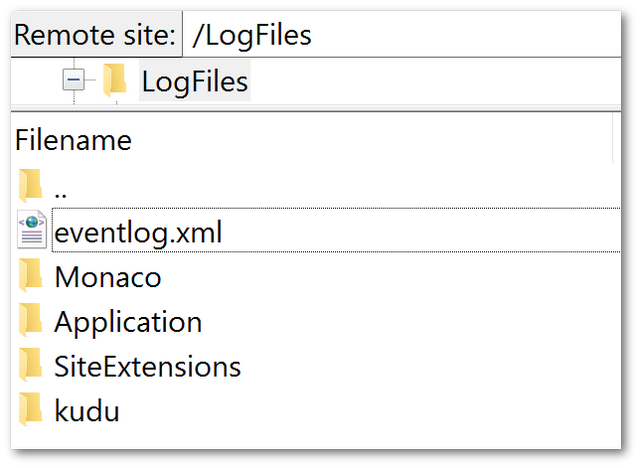
Now if you FTP into your Azure website and look in your 'Log File' directory, you'll see a file called event log.xml. This should show you a number of emails
Umbraco Logs
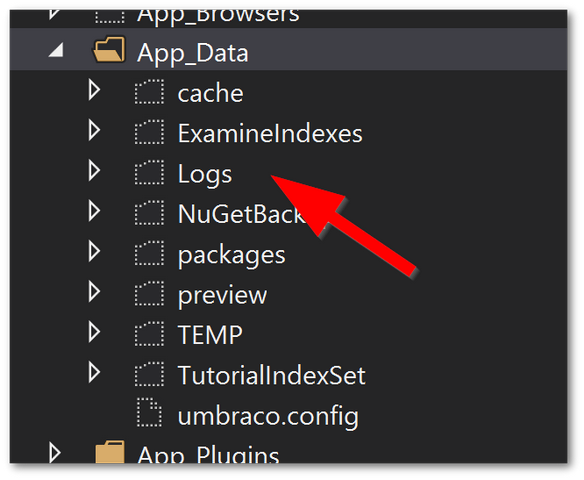
The other place to look for errors is in the Umbraco logs. You can find these within this folder:webroot ➡ App_Data ➡ Logs
Following the process above, I managed to find a number of connection errors. The site trying to connect to Redis and failing. I was using the Stackoverflow Redis provider for managing the sites cache at one point in time. I thought I had turned this feature off, however, on each page request, a constructor was still being called that tried to establish a connection with a Redis server. This constant stream of failing connection requests meant a number of threads weren't being closed correctly, which after a while, caused a performance bottleneck. Disabling this code fixed my issue! Huzzah! To re-cap on ideas to help diagnose your own issues:
- IIS Reset
- Republish/redeploy your code. Sometimes things can go astray while deploying, try publishing your code again just to be sure.
- Clear temp files. Another potential quick win is to clear your Umbraco cache. I know this sounds a little counterintuitive, clear the cache when you have performance issues, however, I've seen locking issues with the cache that has caused the CPU to run at 99%. To do this, FTP into your
App_Datafolder and clear the files withintempandindexes.
It is very unlikely that anyone reading this will experience the same issues as I did, however, the aim of this tutorial was not to give you a walkthrough on how to troubleshoot a potential issue. Happy Coding 🤘