In this tutorial, you will learn how to use the Visual Studio Code debugger. Learning how to debug your code is an essential step to becoming a coding legend 🐉🐲🧝♂️🦄🧚🧙🏽. Luckily, debugging an HTML page that contains JavaSCript is super simple using VS Code.
First, the best debugging tip is learning how to write to the debug console. The process is super simple. Create a new project with an HTML file. Add a script tag and add some JavaScript to it. Next, log out some data using normal console.log() as can be seen below:
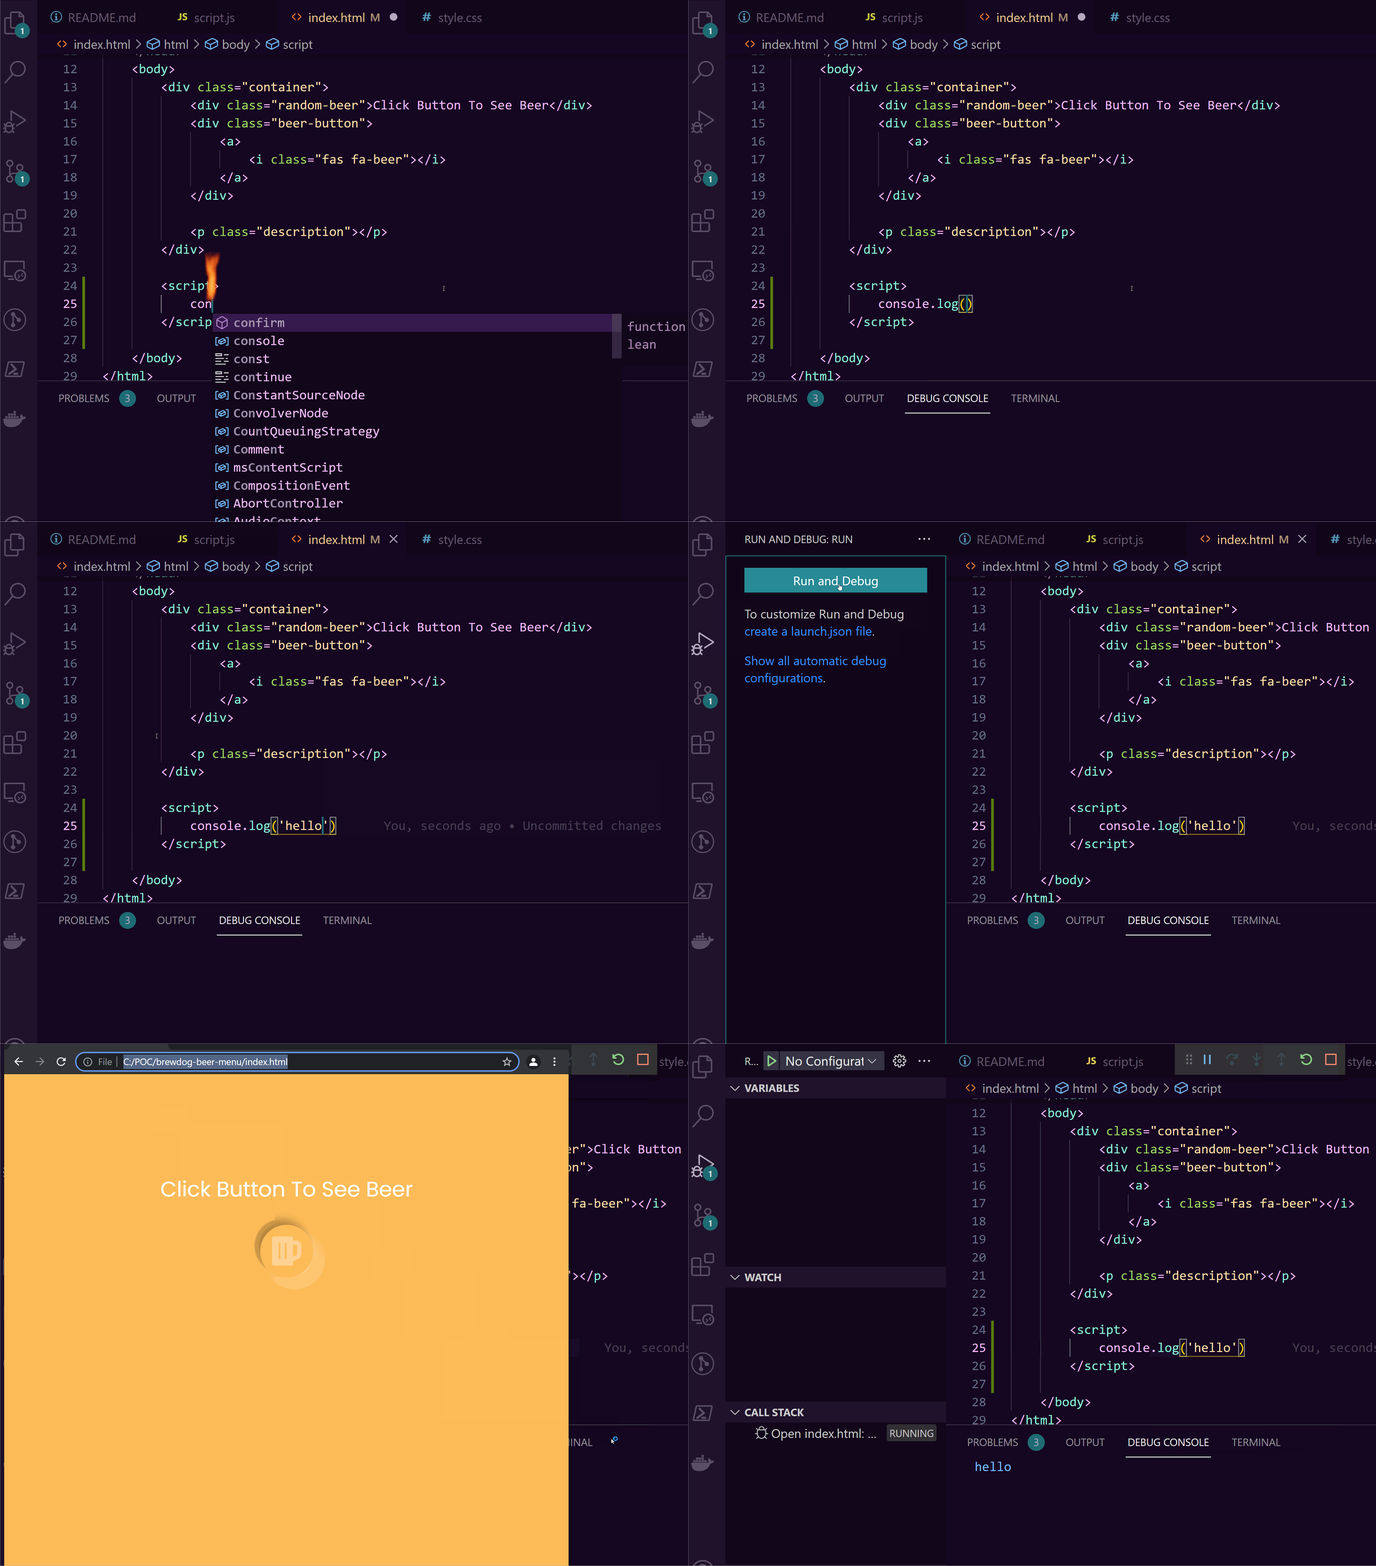
In the side ribbon, click on the 'Run and Debug' option, or, use the shortcut key Control + Shift +J. On the screen that pops up, click the 'Run and Debug' button. In your debug console you should now see the output of your console.log statement. This technique can be useful when you don't want to leave VS-Code and you want to check data. Get data from an API on page load, render it out here 🔥🔥🔥
Using console.log() isn't the only useful feature of the debug console. Once the debugger has launched and attached, you can also use it to query the element on the page. The benefit of using the console to access elements is that you get access to a handy shortcut. Instead of having to type out document.querySelector() you can use $ as a quick reference. Lets see it in action:
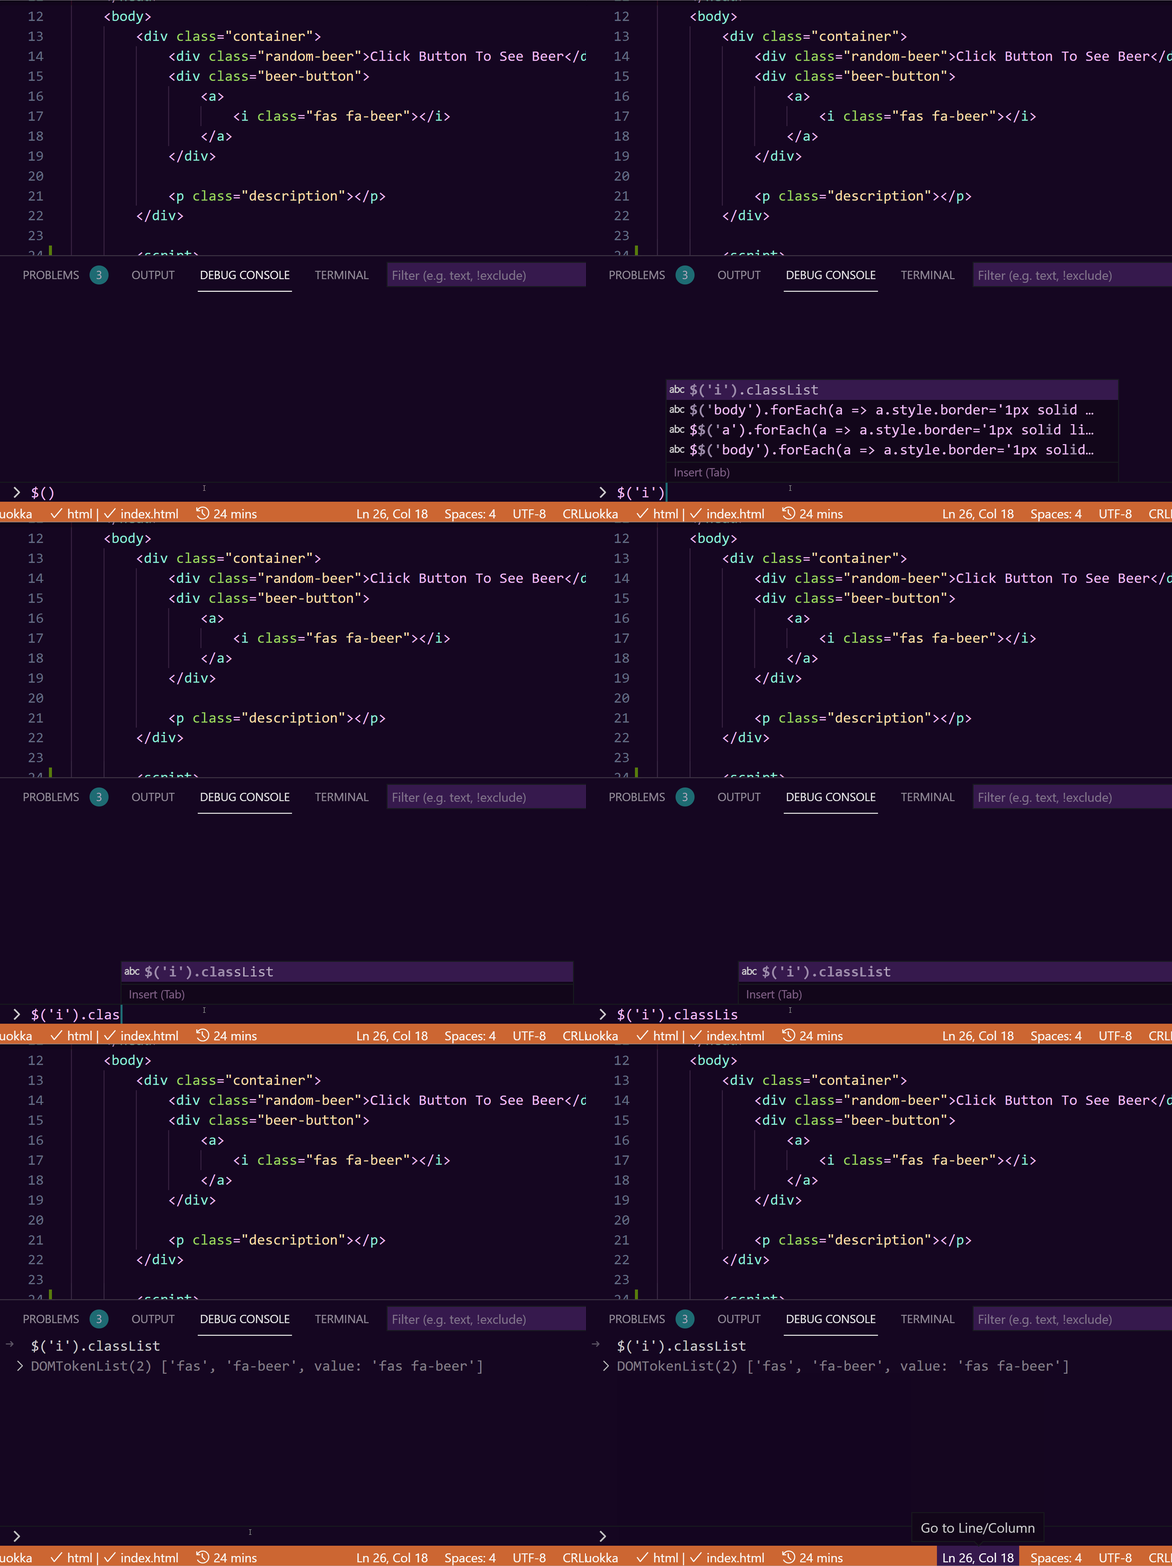
You can obviously use the debug console to do the same things as you could within the usual browser console tab. You can find more information about what can do in the debugger console, here.
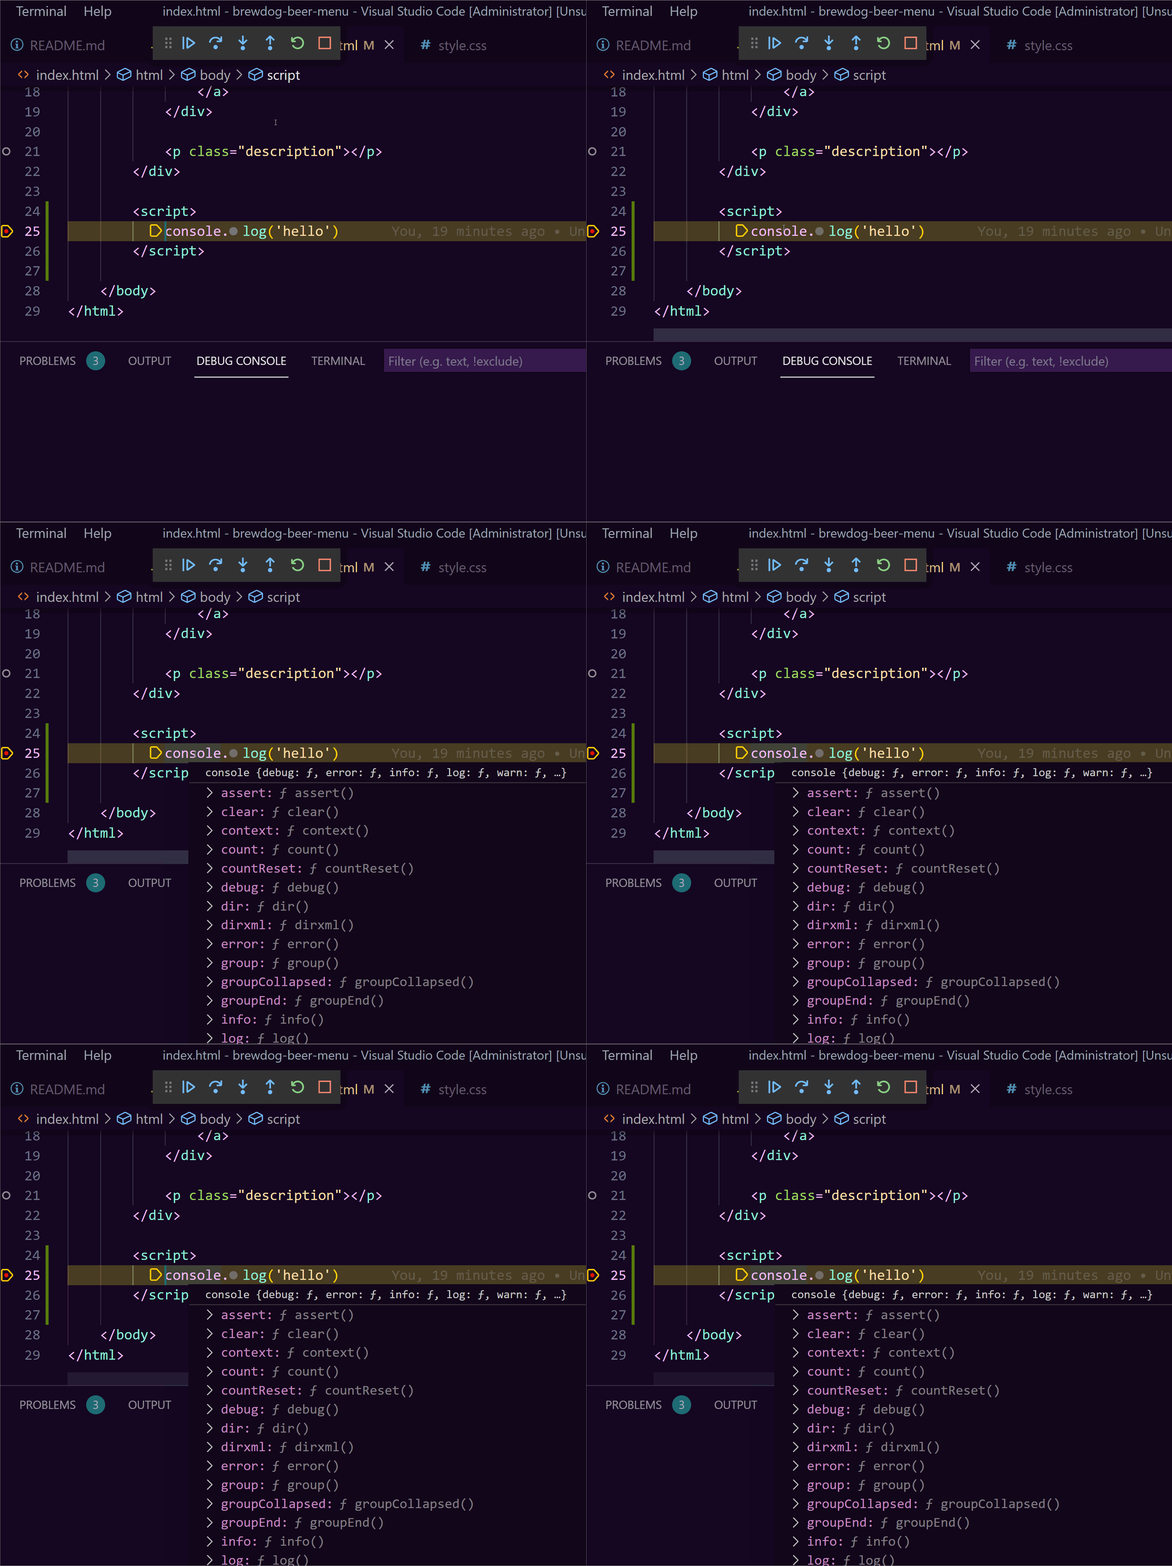
The final tip that I will leave you with is the humble breakpoint. Adding breakpoints to your code will make debugging much easier. See below on how to add one:
Happy Coding 🤘
